
How Asteroid Impact Risk Predictions Tend to Shrink – Philip Plait Explains
How Asteroid Impact Risk Predictions Tend to Shrink – Philip Plait Explains https://asteroidday-uploads.s3.eu-central-1.amazonaws.com/wp-content/uploads/2025/03/17120204/2.png 1080 1080 Asteroid Day https://asteroidday-uploads.s3.eu-central-1.amazonaws.com/wp-content/uploads/2025/03/17120204/2.png
How Do Scientists Predict Near-Earth Asteroid Flybys? Asteroids are constantly passing by our planet, and every so often, one gets close enough to make headlines. But how do scientists predict whether an asteroid might impact Earth? And why do these predictions sometimes change over time?
In February, asteroid 2024 YR4 caught astronomers’ attention when initial calculations suggested it could pass very close to Earth in 2032—perhaps even too close for comfort. But as more observations came in, the picture became clearer, and the uncertainty around its trajectory began to shrink.
In his latest article, astronomer and science communicator Phil Plait explains how asteroid impact predictions evolve over time, using a fascinating graph from the European Near-Earth Object Coordination Centre. In this piece, we focus on the section discussing how astronomers refine their calculations for near-Earth asteroids like YR4.
To explore more insights from Phil Plait, you can read the full article here.
How near-Earth asteroid miss predictions work
Graphic shows how uncertainty drops with time
I don’t often show y’all graphs of data — I know a lot of people have a hard time with them — but I saw this one and just had to write about it.
Remember the asteroid 2024 YR4 from February? We knew it was going to get close to Earth in 2032, but not sure how close. Astronomers couldn’t rule out an impact, though the chance was low.
The European Near-Earth Object Coordination Centre newsletter for March 2025 had this plot, which shows how well we knew where YR4 would be in December 2032. I’ll explain it below.
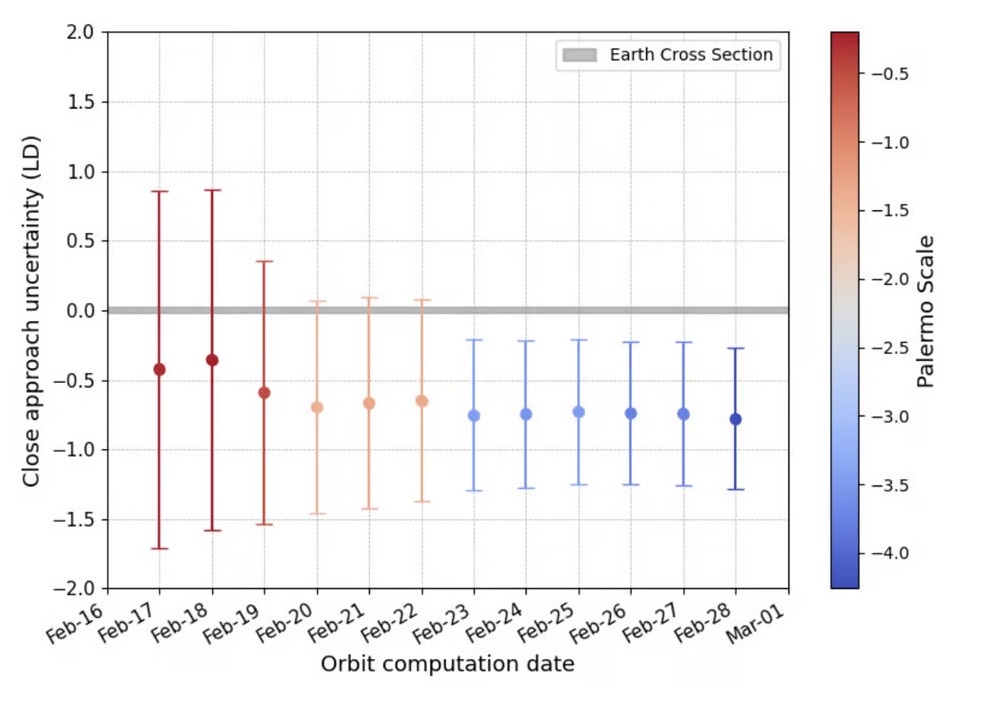
The predicted position of 2024 YR4 over time. Credit: NEOCC
The graph shows the predicted distance from Earth of the asteroid at closest approach in December 2032. The dates along the bottom are the days each prediction was made. So, each point represents the position of the asteroid at closest approach that was predicted on that date, given the observations in hand at that time.
The vertical y-axis shows that distance from Earth in units of lunar distance, the distance to the Moon (about 380,000 km). The size of the Earth is shown in the gray bar going across the middle (at y=0), although I think it’s exaggerated a bit vertically.
There are a few things to note. One is that the dots are the actual best estimate of the asteroid’s distance. But note the “error bars”! These show how well we understand that position; the larger the bar the less certain we can be. Statistically speaking, the bars represent what scientists call the three-sigma uncertainty; the easiest way to understand it is that there’s a 99.7% chance the asteroid will be somewhere between the top and bottom of the bars.
Original Article “How to watch this week’s lunar eclipse! Also, how asteroid impact risk predictions tend to shrink” published by Philip Plait in Bad Astronomy Newsletter.